poker diaries, volume 2: study
so far this week
This post isn’t really about my sessions this week since I haven’t played much, but I’ll give a brief (for me) update. I played my first session of the week last night, mixing in some $50nl and $100nl. It was a decent session but I only got around 770 hands in due to a disrupted sleep schedule. I spent the 4th with my girlfriend and her family. I was kind of resistant of going because I knew it would disrupt my sleep schedule (I went from going to bed at 4 am to waking up at 7am in 2 days), but I’m really happy I went. Balancing poker grinding with friends, loved ones, and life in general is notoriously tricky. It’s easy to get wrapped up in the study/play cycle, and this is only worsened by a weird sleep schedule where my life doesn’t line up with anyone elses. So it was really important for me to make time to do this, and I’m happy I did.
But yeah, it was good to run well at my first $100nl session.
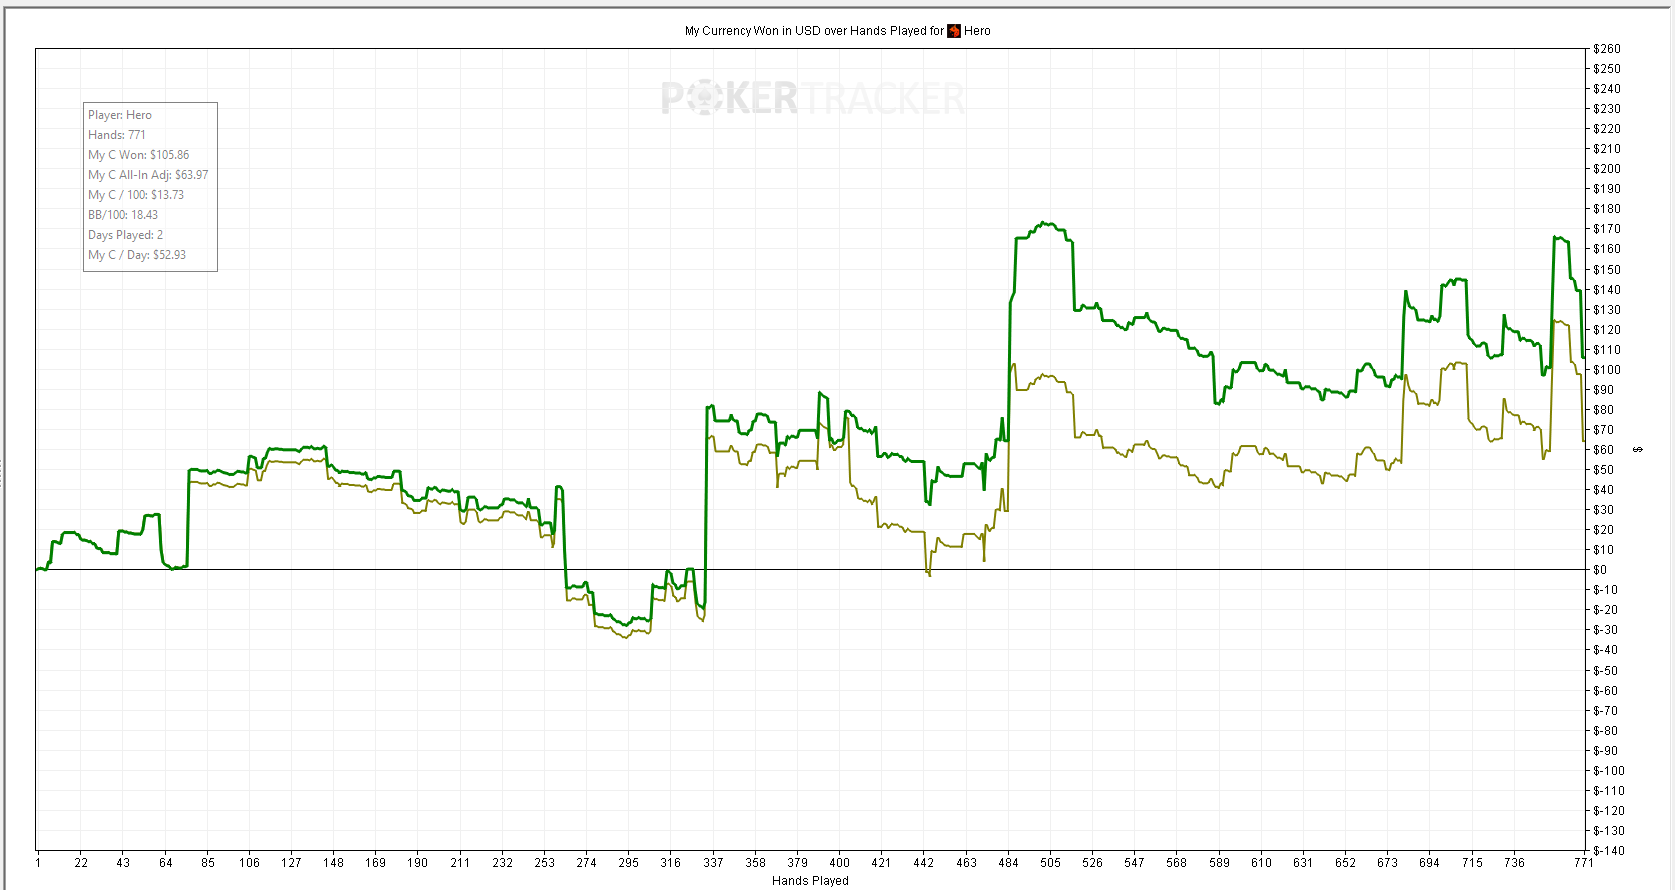
Graph of Saturday's session.
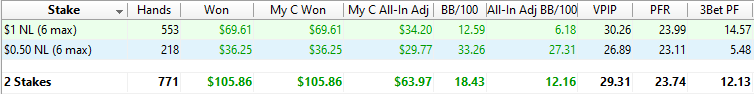
Breakdown by stake.
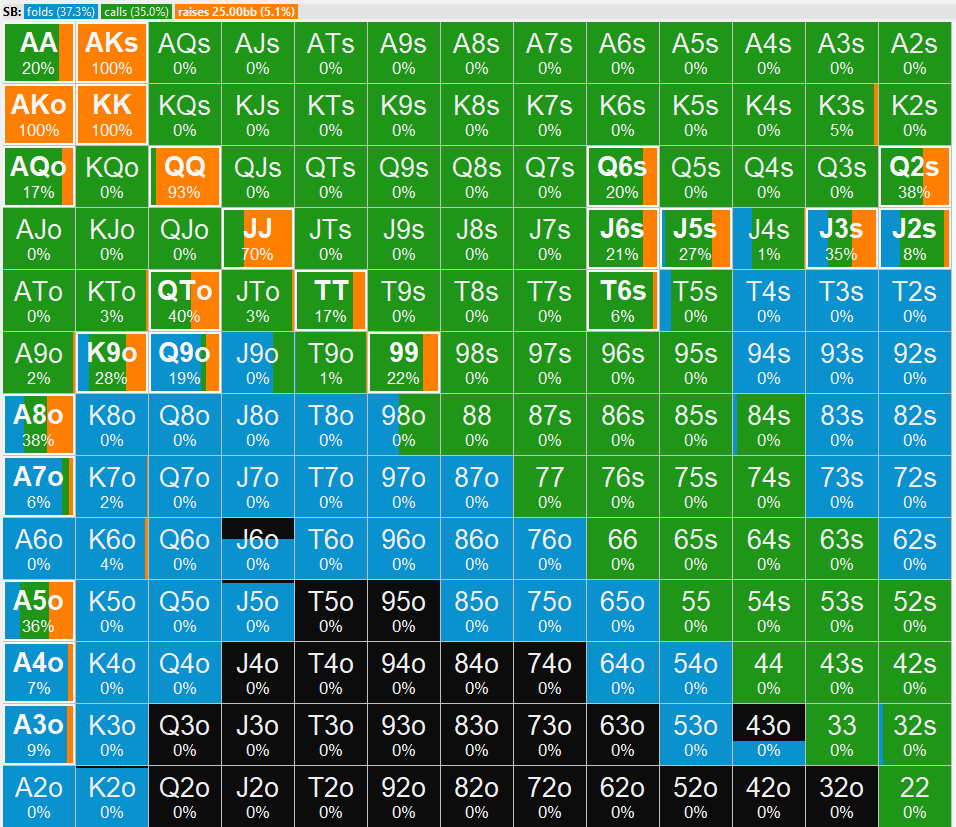
Overall 771 hands is meaningless, pure noise really. However, I’ve been consistently winning between 10bb-20bb/100 so far, which is a good sign. If you notice, my VPIP and 3Bet frequencies are pretty high for 100nl. This is because I played some heads up (2 player) which has very high VPIP and 3bet frequencies. I love heads up, and I thoroughly enjoy playing versus players on Ignition who definitely have not studied the format. For instance, the HU 4betting range in is extremely polar, and you end up 4betting hands like J5s.
Graph of Saturday's session.
This led to the following hand:
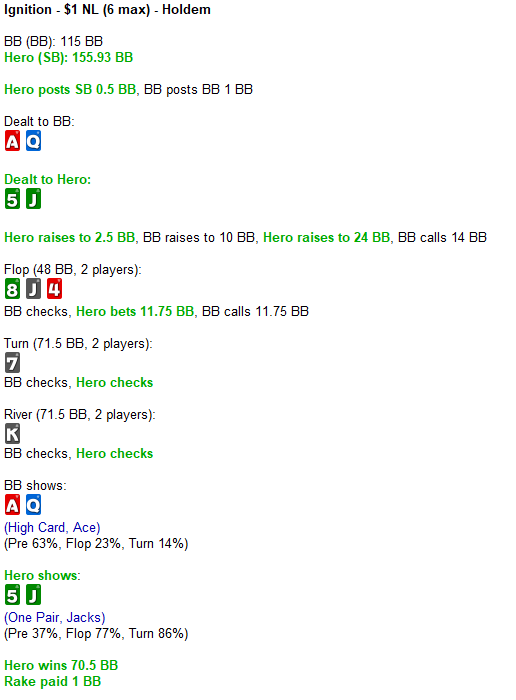
Graph of Saturday's session.
They snap quit me after this hand, probably thinking I was the biggest fish in the world. Truth be told, I probably didn’t play post flop accurately. I might have wanted to barrel turn, but I felt like I had the best hand a lot, and I might narrow villain’s range if I continued putting money in to where I only get called by better.
Anyway, where was I? Oh right, the downside of taking a couple days off is that now I’m horribly out of whack and I can’t seem to settle back into my schedule. I lost a couple days of playing, and now I’m losing volume because of bad sleep. This means I’m probably only gonna get around 2.5k hands this week which, if I’m being honest, is stressing me out. I realize I’m being kinda crazy about it, but I really want to prove to myself that I can play professionally, and a big part of that is consistently showing up. I also only have another couple months to do this before I go back to school, so time really is of the essence.
strategy building
Though I took a couple days away from playing, I’ve still been studying. I’m currently strategy building, which is this one-time cost you have to pay at the beginning of your poker career to build an entire strategy from scratch. There are many ways to do this. Some people will buy courses that outline the major strokes of a strategy (perhaps for a specific node of the gametree). I’ve always had a rough time watching courses, I get too distracted by details and don’t make it through. With that said, I found Uri’s course on check raising extremely helpful and I’m going to continue to watch other courses here and there.
Other folks will hire a coach and have them work through a strategy. I have an unofficial coach (or rather, an official coach who I also count as a friend and is very generous and doesn’t charge me money, even though I keep telling him I’m ripping him off), Salamander, who I credit for fundamentally changing the way I think about the game. He’s worked through how he thinks about a bunch of different spots, and given me a system to work within. I use some of it, but I haven’t incorporated everything he’s shown me yet. I’m slowly working up to that, but I also like to figure things out for myself. I’ve also been too busy before this to be able to put the time in to fully understand and implement his approach.
While I’ve taken a lot from Salamander, I really enjoy solving puzzles, and building a strategy from the ground up is really appealing. I’m running lots of simulations using a tool called PioSOLVER to help me learn the mechanics of the game.
Poker, however, is a huge game and it’s hard to develop a plan of attack for learning the massive amounts of information needed to succeed at the table. Poker solvers like Pio, while incredibly useful and a huge part of modern poker study, are not easy to use. It’s easy to get lost in what I like to call solver noise, especially if we are not clear about why we are studying a solver’s output.
My goal in studying is to simplify the solver outputs as much as possible until there is a clear takeaway that I can use in my games. My goal is forever to “fit my thoughts on an index card”. I want to build an implementable strategy, and that means having nice abstractions and understanding the interactions between those abstractions.
Solver study often results in the exact opposite: I might notice seventeen different patterns that sometimes hold, sometimes don’t, and in game this can lead to juggling seventeen low level concepts rather than quickly isolating the two or three crucial pieces of information that will lead to me generating edge.
So how should I study the game to efficiently build a strategy that is simple enough that I can implement it in game? I have a principled approach: I want to avoid introducing complexity to my strategy at all costs. Now this is not to say that I will never do tricky things, or deviate my game plan based on opponent tendencies. But I want to keep my baseline strategy dead simple and easy to know/execute. Overtime, I will find leaks in my game, places where I have over simplified. I will then introduce complexity to shore up those leaks, but only as necessary.
However, complexity is part of the game, and I’m going to need to put it somewhere. I’ve decided that I want to put my complexity in later nodes of the game tree. Why? Well, if I range bet a board then it’s likely that I just take the pot down, and I might never need to reach the point where my strategy gets complex. Also, I think that I’ll be better able to navigate complex situations than my opponents because I am putting in the work.
Finally, I want to keep my opponents ranges wide. If you believe that most players suck at poker, then you should also believe that you want them to make as many decisions as possible. This makes range checks very appealing to me, and it’s something that I’m toying with implementing.
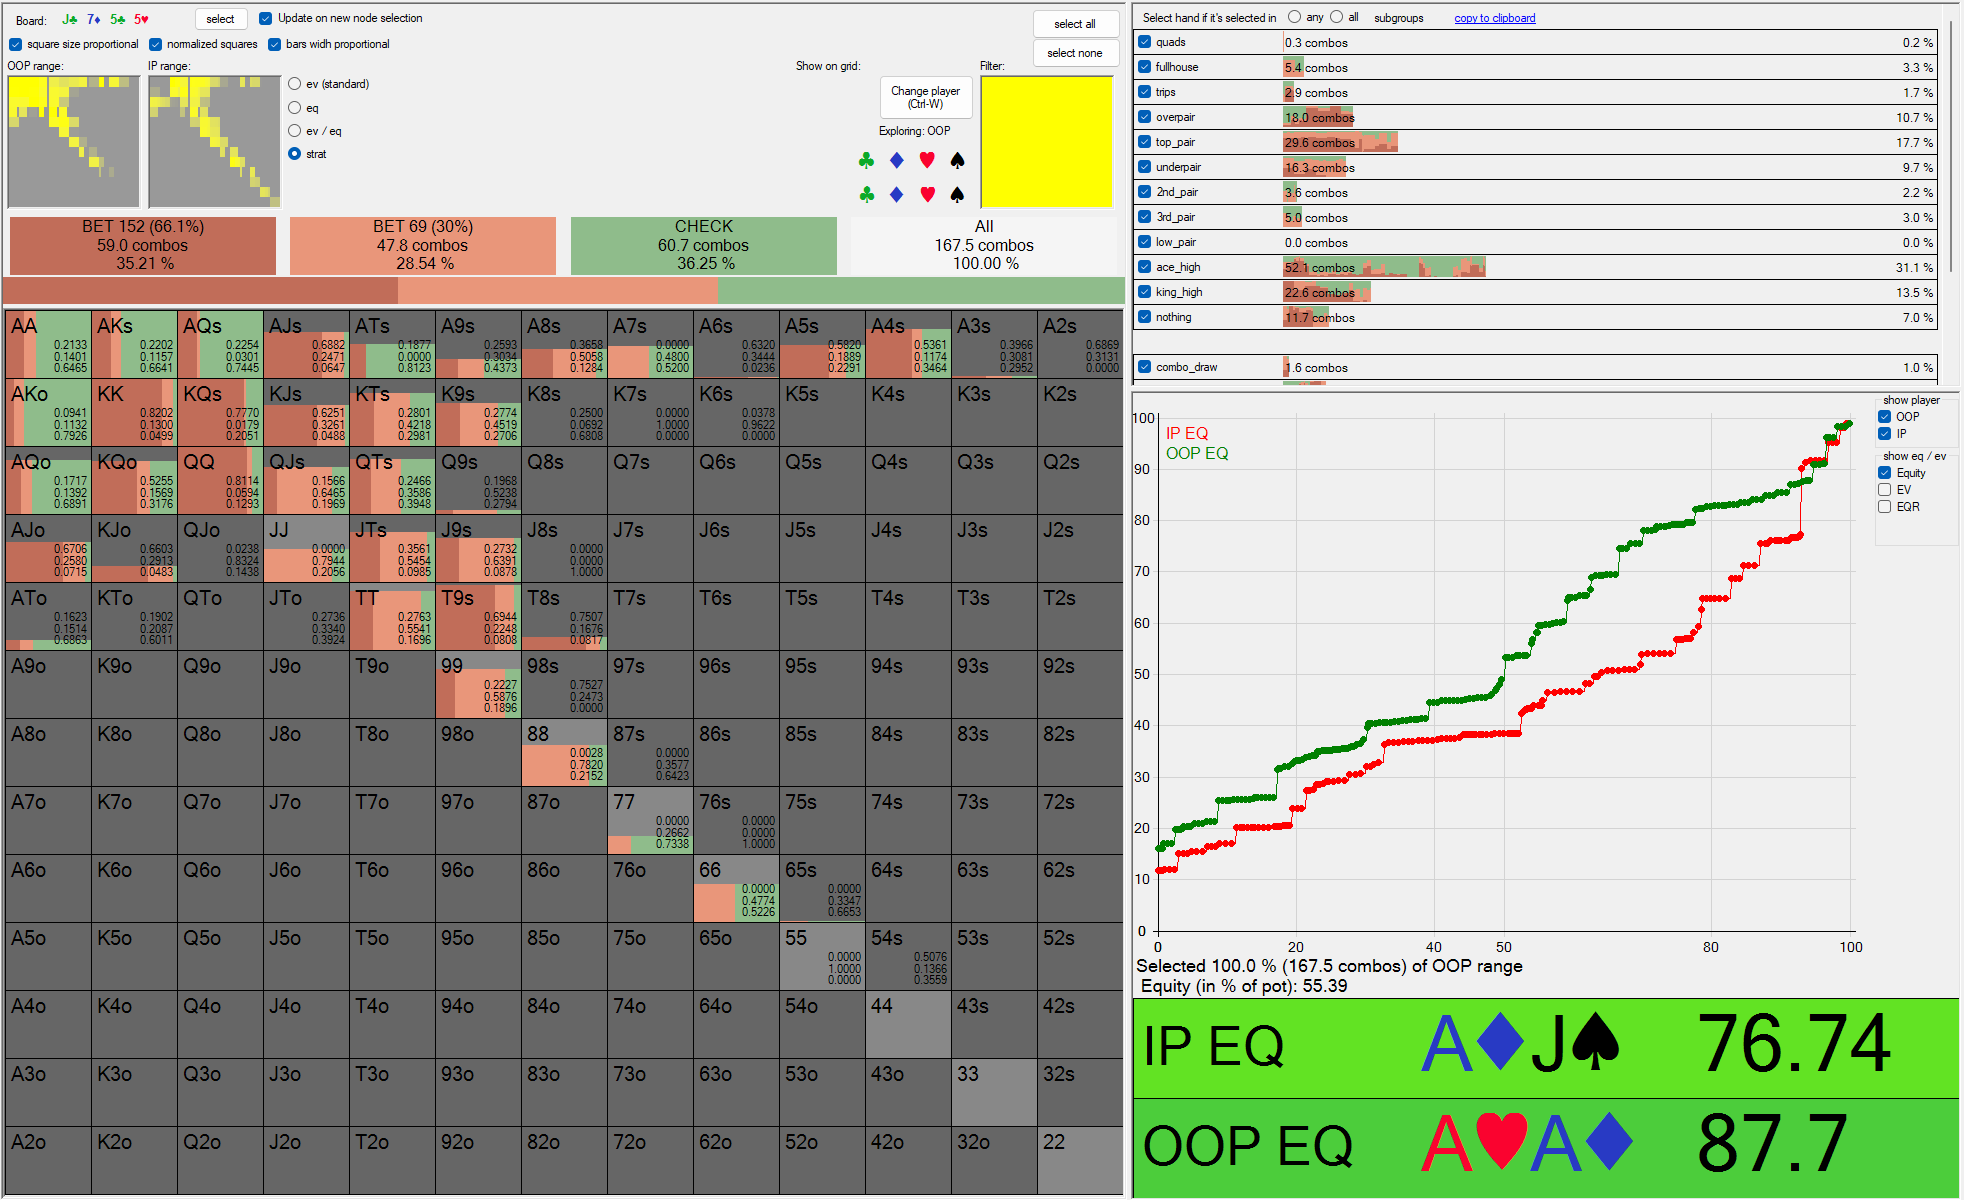
For example, I’m studying SBvBTN 3bet pots right now. I ran all 1755 strategically distinct flops with a bunch of different configurations, including allowing mixed cbet sizes, range b33, and range checks for the SB. I then isolated different board textures and plotted the EV of each “simplified” cbet strategy for the SB against the EV of the mixed strategy. For example, here is what I found for A-high boards:

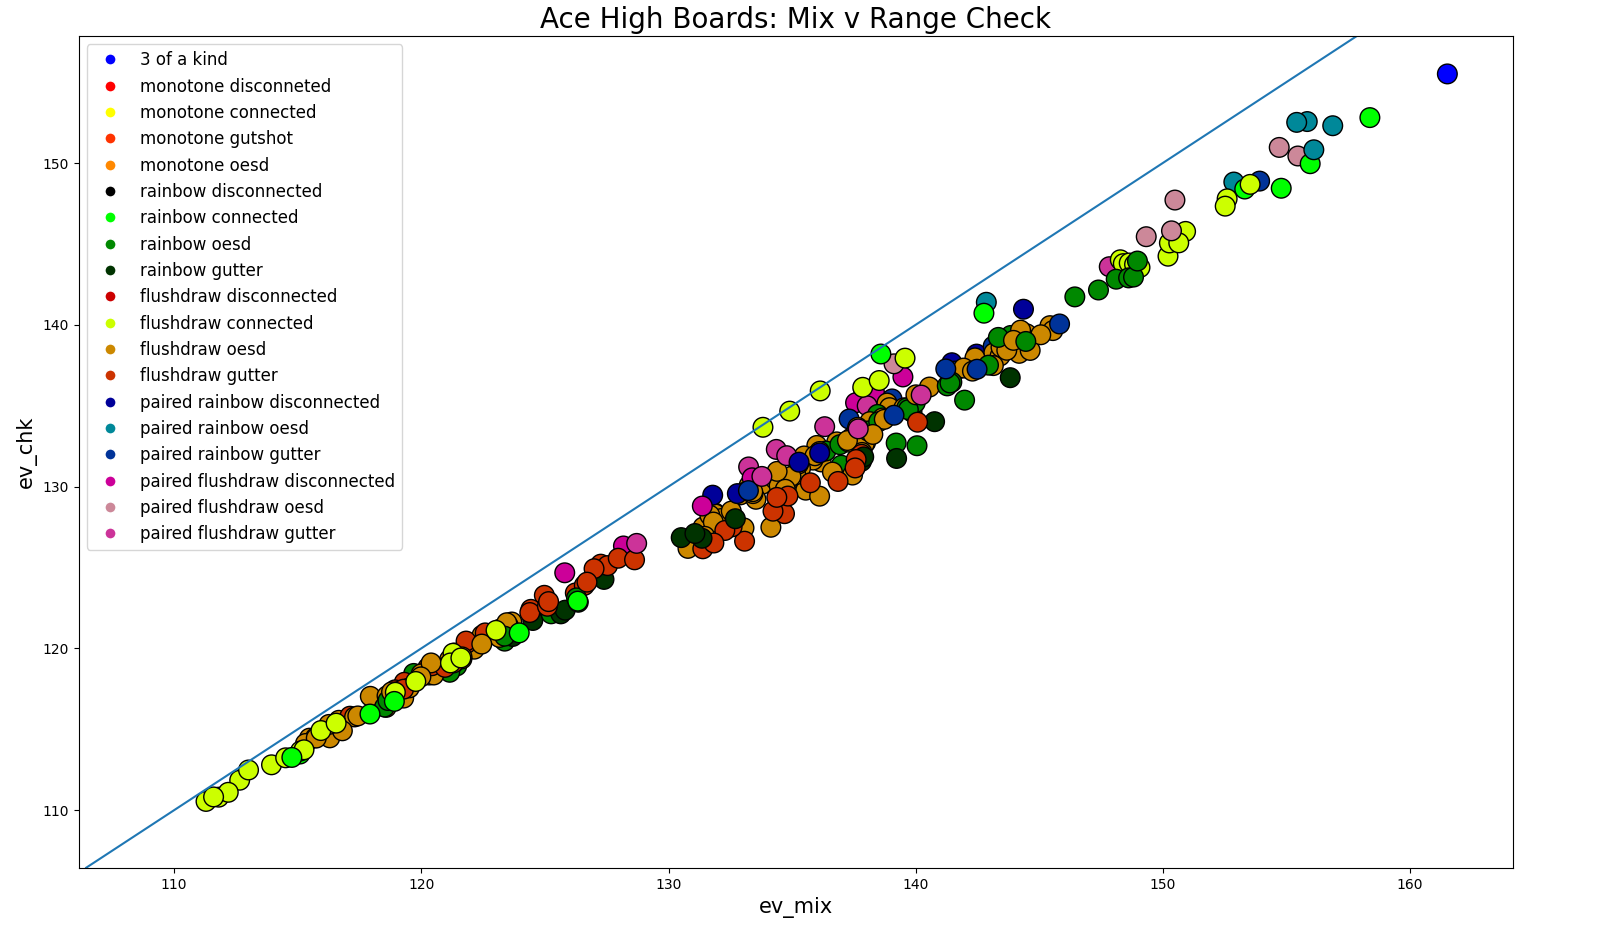
Currently I’m using the range bet strategy because it is higher EV, but I like the idea of implementing a range check board. It’s lower EV, but people will play worse versus it. Everyone has played versus a range bet strat, but people do not play well versus checks. By bringing folks to delay and double delay lines I think I can realize some serious edge. People tend to play pretty face up in unfamiliar or understudied spots.
Strategy building is not an easy task: simplifying an inherently complex system is non-trivial since tweaking one part of a strategy affects every other node of the game tree. However, I have several things working in my favor. First, I have a very powerful computer that can quickly run simulations. This will let me quickly test ideas and iterate my strategy building. Second, I am a programmer by trade, and this puts me in a position to write code to automatically analyze solver outputs, allowing me to quickly find high-level patterns. After all, being able to quickly run 10k solves is not useful if I can’t easily compile the data into something consumable and understandable.
solvers and equilibria
Poker solvers approximate “good” poker strategies called Nash equilibria. A Nash equilibrium is just a strategy with a very desirable mathematical guarantee: if I am playing my equilibrium strategy then the opponent cannot do anything to make more money against me. They may mess up and give me more money than I expect, but I am guaranteed to win a certain amount, in the long run, by playing an equilibrium strategy.
Roughly, an equilibrium is a balance of forces. In poker we need to balance many considerations to have a robust strategy, and when we become unbalanced our strategy becomes vulnerable to exploits. For example, if I only bet when I have a very strong hand, then my opponents will realize that when I bet I am very strong, and they can play perfectly against me, never bluffing when I bet, and only calling with high equity hands that can beat my strong hands. Thus, I want to balance my strong hands with some bluffs. However, if I bluff too much then they can always bluff catch, and now I’m losing money by bluffing too much. Thus, I want to bluff just enough so that the opponent is indifferent between bluff catching and folding. This dynamic is captured nicely in the AKQ game which Andrew Brokos’ Play Optimal Poker sums up nicely.
Equilibria are far too hard to compute by hand, and we appeal to solvers such as PioSOLVER to compute them (or, more accurately, approximate them) for us. Unfortunately, the output is complex, and we can’t just look at a sim for a few minutes and understand the it. What’s more, even if we understand a single board relatively well, we still don’t know anything about different boards.
So how should we proceed? There are different philosophies on this. Some folks delve deep into a sim with the intention of learning all its peculiarities. It’s important to spend some time doing this, and what’s more it can be very fun to do this (if you’re a fuckin nerd like me). But it’s also easy to get sidetracked by minutia. Some players get obsessed with frequencies: this board bets 40% while this one bets 45%. Other players try to compute simple strategies that are easy to implement. These players are more likely to play massive volume: they may not have the most complex strategy but it’s dead simple to play, and this allows them to play many tables at once.
I don’t think I’m going to ever be a volume player, and I love the creativity of poker. But rather than trying to grapple with all of its complexity at once I want to learn the broad strokes first. I want to start with a dead simple strategy and introduce complexity as needed. I want to understand the underlying mechanics of a position and figure out what my overall range wants to do, and then figure out how my hand fits into that game plan.
To do this I’m running tens of thousands of sims. I’ll begin by identifying a “spot” I want to understand better, such as “Action folds to the button who opens to 2.5bb. The smallblind raises to 11bb, the bigblind folds, and the button calls.” At this point, the game would proceed by going to a flop, where the smallblind would be first to act. First, there are 1755 strategically distinct flops that can come. Of course some flops are similar to others, but to be totally rigorous I want to run sims for each flop in a spot. I also want to construct a game tree which tells the solvers which actions each player is allowed to perform. Can they each bet/raisex 4 different sizes at each node? Or maybe a player is only allowed one size? Each choice will tell me something different.
Typically there is a tradeoff: more options for a player leads to longer solve times and higher complexity of that player’s strategy, but also to more EV (expected value), since there are more things that player can do. So my main question when I start running sims is “how much can I strip away from a player’s game tree without costing them EV?”
I’ll begin by giving a player many possibilities and running all 1755 sims, and use this as a baseline strategy to compare EVs against. Then I will strip away options for the player to determine how much EV loss this corresponds to.
For instance, I might run a sim where the smallblind can check, cbet 33% of the pot, or cbet 66% of the pot. However, I don’t want to learn this strategy because it is far too complex. So I will also run five more sets of sims:
- one where the smallblind can only bet 66% pot with range (no 33% or checking)
- one where the smallblind can only bet 33% pot with range (no 66% or checking)
- one where the smallblind can only check with range (no betting at all)
I then run aggregation reports that collect high-level statistics of a set of solves for every board and output the data to a CSV. The output of an aggregation report might look like this:
Flop,Global %,OOP Equity,OOP EV,OOP EQR,IP Equity,IP EV,IP EQR,BET 152 freq,CHECK freq
2h 2d 2c,100,56.11,153.082,118.621,43.89,75.4181,74.7089,81.77,18.23
3c 2d 2c,100,53.74,125.268,101.345,46.26,103.232,97.0273,55.92,44.08
3d 3c 2c,100,54.16,130.457,104.727,45.84,98.0432,92.9922,59.80,40.20
3h 3d 3c,100,56.39,155.822,120.143,43.61,72.678,72.4577,84.49,15.51
3h 3d 2c,100,54.89,138.028,109.324,45.11,90.4718,87.2063,68.16,31.84
3h 2d 2c,100,54.48,132.507,105.756,45.52,95.9924,91.6794,64.97,35.03
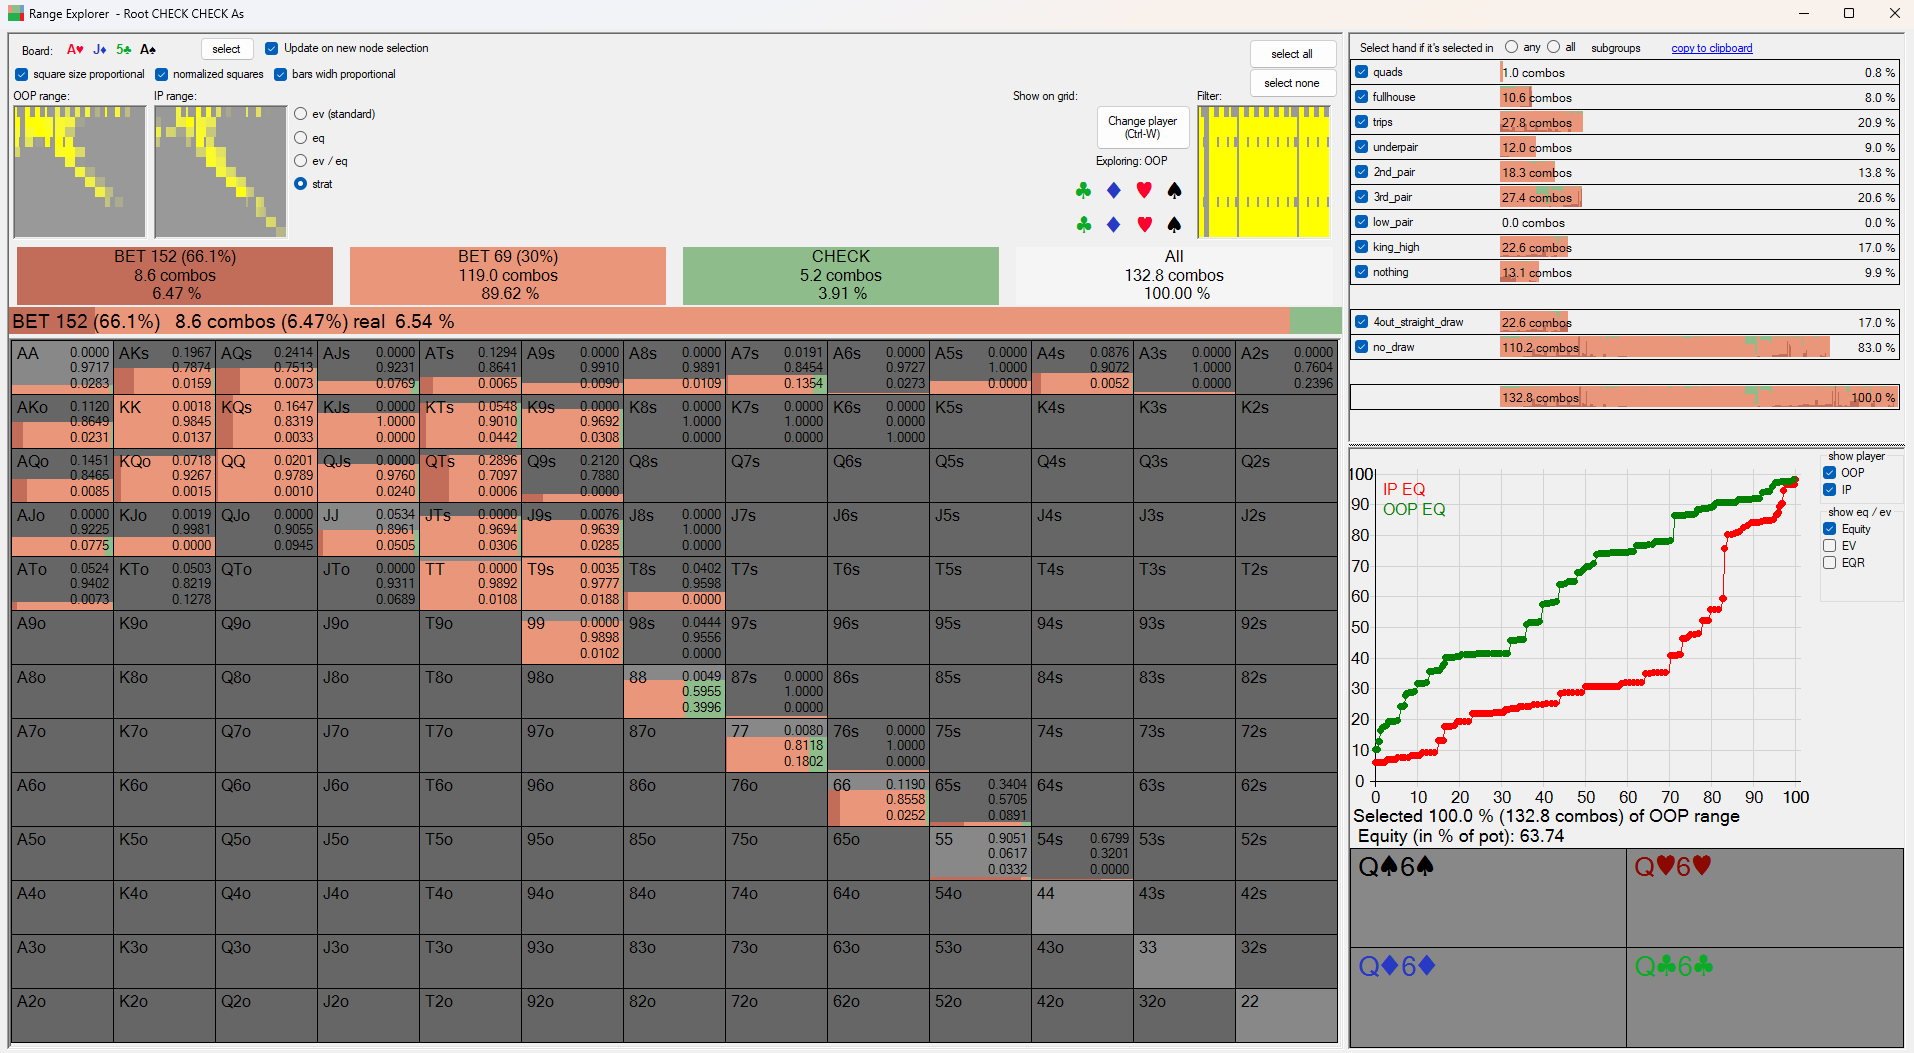
This is not very readable, and to help me understand it I’ve been working on Pious, the Pio Utility Suite. The project is still in the brain dump phase, and it would honestly be hard for anyone else to hop in and use many parts of it right now. But there are a few parts of it that are easy to use today (assuming you know some Python). One of them is the aggregation report module, that allows you to view aggregation reports, filter them down based on certain criteria, plot different variables against one another, etc. Here is a sample session looking at the aggregation report of SB’s cbet node:
>>> import aggregation.report as ar
>>> r = ar.AggregationReport("/Users/benku/DPS/PiousStrats/reports/SimpleTree/3BP/b66/SBvBTN/Root")
>>> r.describe()
            equity           ev          eqr      bet_152        check
count  1755.000000  1755.000000  1755.000000  1755.000000  1755.000000
mean     54.862695   126.054526    99.659857    51.678353    48.321647
std       3.144132    14.210141     6.962486    22.635363    22.635363
min      47.920000    83.745000    74.755400     0.000000     0.000000
25%      52.255000   116.066000    95.242800    36.040000    32.215000
50%      54.740000   125.599000    99.347900    51.950000    48.050000
75%      56.975000   136.111000   103.980500    67.785000    63.960000
max      64.870000   169.516000   126.283000   100.000000   100.000000
>>> r.plot()
I begin by importing my library, giving it the easy-to-type handle ar (this is
short for aggregation.report). Then I load up the aggregation report output by
Pio (located at "/Users/benku/DPS/PiousStrats/reports/SimpleTree/3BP/b66/SBvBTN/Root")
as an AggregationReport object that I name r. I use r.describe() to get a
quick overview (this shows that there are 1755 different flops, with a mean EV
of 126.01 chips, and that across all boards the smallblind cbet about 51.7% of
the time). Finally in the last line I ask to plot the data, which produces the
following plot:
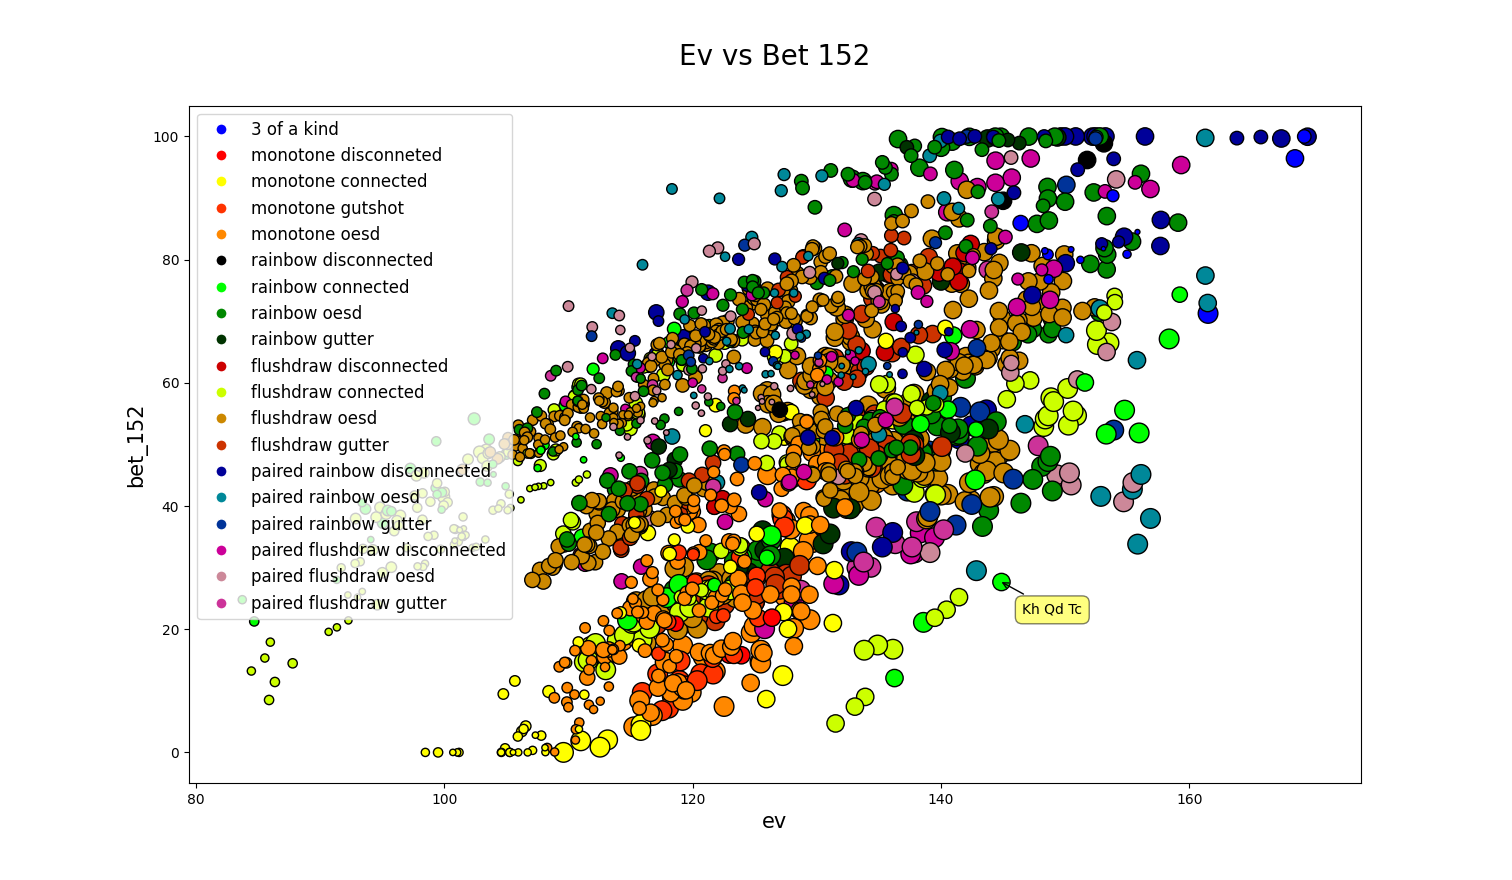
Each color corresponds to a different board texture, and different sizes correspond to different high cards on the flop. The largest points are A-high boards, while smaller points correspond to smaller boards. Yellow/Orange boards are monotone boards, while greener boards are connected boards. Blue boards are paired and trip boards. The colors aren’t perfect just yet…it’s hard to find 20 distinct colors that each mean something and ‘make sense together’, but I’ll iron that out. But it’s easy to see patterns right away. For instance, flush boards have a lower betting frequency, or straight boards (green) tend to have higher EV (to the right) when they are A-high (larger circles).
Maybe we want to investigate this further. We can filter the current board and plot the result:
# Next I'll filter to only show straight boards without flushes, and plot
# the result without showing the legend (which takes up a lot of space)
r.filter('straight and not flush')
r.plot(legend=False)
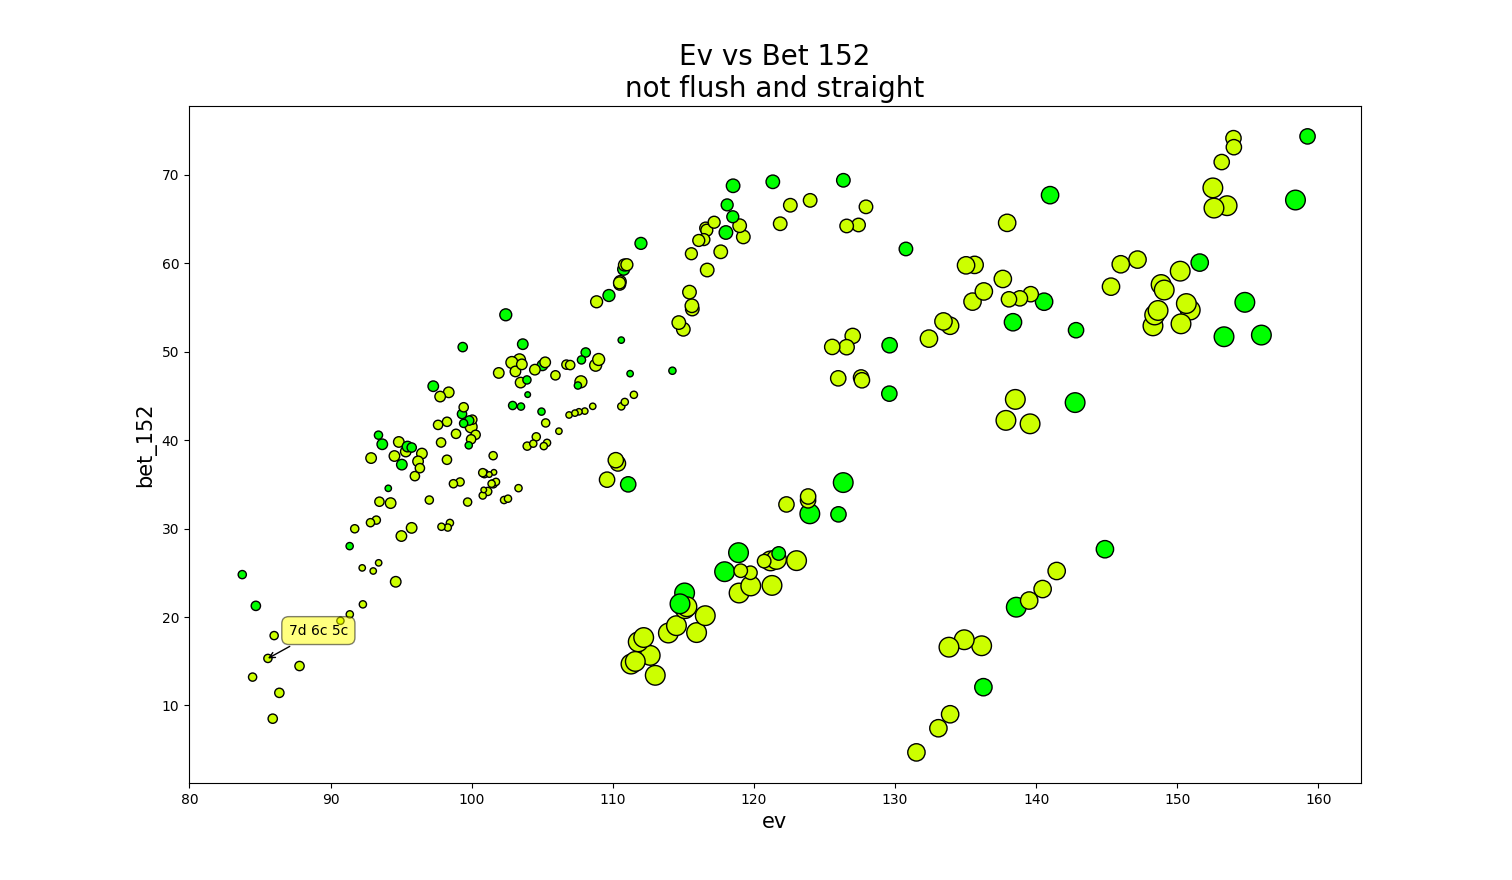
In this way we can get quick high-level visualizations of spots to better understand them. I can also compare different sims (in fact, the plots above comparing range checks and range bets against a mixing strategy were made using Pious). I’ll talk more about some of Pious’s capabilities in the next post, and show how I am using it to strategy build.